50YAcht
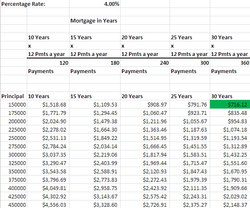
In this assignment I created a chart showing the mortgage costs after a certain amount of years and the principal. I used the Payment "PMT" function to calculate the payment for a loan based on constant payments and a fixed interest rate. This assignment was very helpful because I now know how to calculate different loans based on varying years and interest rates. Doing this can help me saves thousands on tax dollars.
Bar Graph Power Point
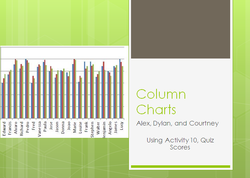
Our team consisting of myself, Dylan, and Courtney had created a Powerpoint to demonstrate how to create/use bar graphs to the class. We thought the class what kind of things bar graphs are used for and how to create one using statistics like grades, that was previously used in Activity 10.
Group Project Activity
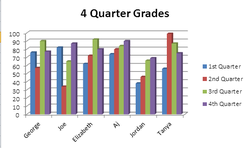
In this assignment I worked with my teammates to create an assignment involving bar graphs. We had no prior knowledge of using bar graphs so everything we did we researched to learn how to perform certain things. We worked very well together and had no conflicts. We created an assignment based on grades of students over 4 terms, modeled after a prior activity.
22Excel
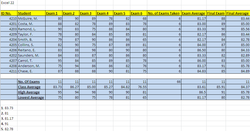
In this assignment I learned how to use Excel Formula Features. I used functions like the COUNT, AVERAGE, MAX, MIN, and SUM functions. I can see how teachers or anybody can use excel to record information and use the functions to calculate things faster.
37Stocks
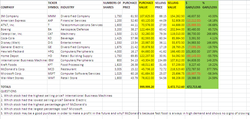
In this assignment I learned about the stocks and applied them to Excel. I learned that stocks are the basic units of ownership in publicly traded companies and people invest in them. I learned how I could use Excel to determine gains or losses from investments in stocks.
